

Our Ontology Manager: Modeling Your Business
Our Ontology Manager is where the most critical step of your analytics journey begins. Before you can build a single trusted dashboard or ML model, you must first create a clean, reliable map of your business. This is that tool.
Here, you will transform raw, physical data tables into a meaningful "digital twin" of your enterprise. You will create the reusable Objects (e.g., Customer, Product) and define the Relationships between them that become the single source of truth for the entire Arkham platform.
1. The Ontology Graph
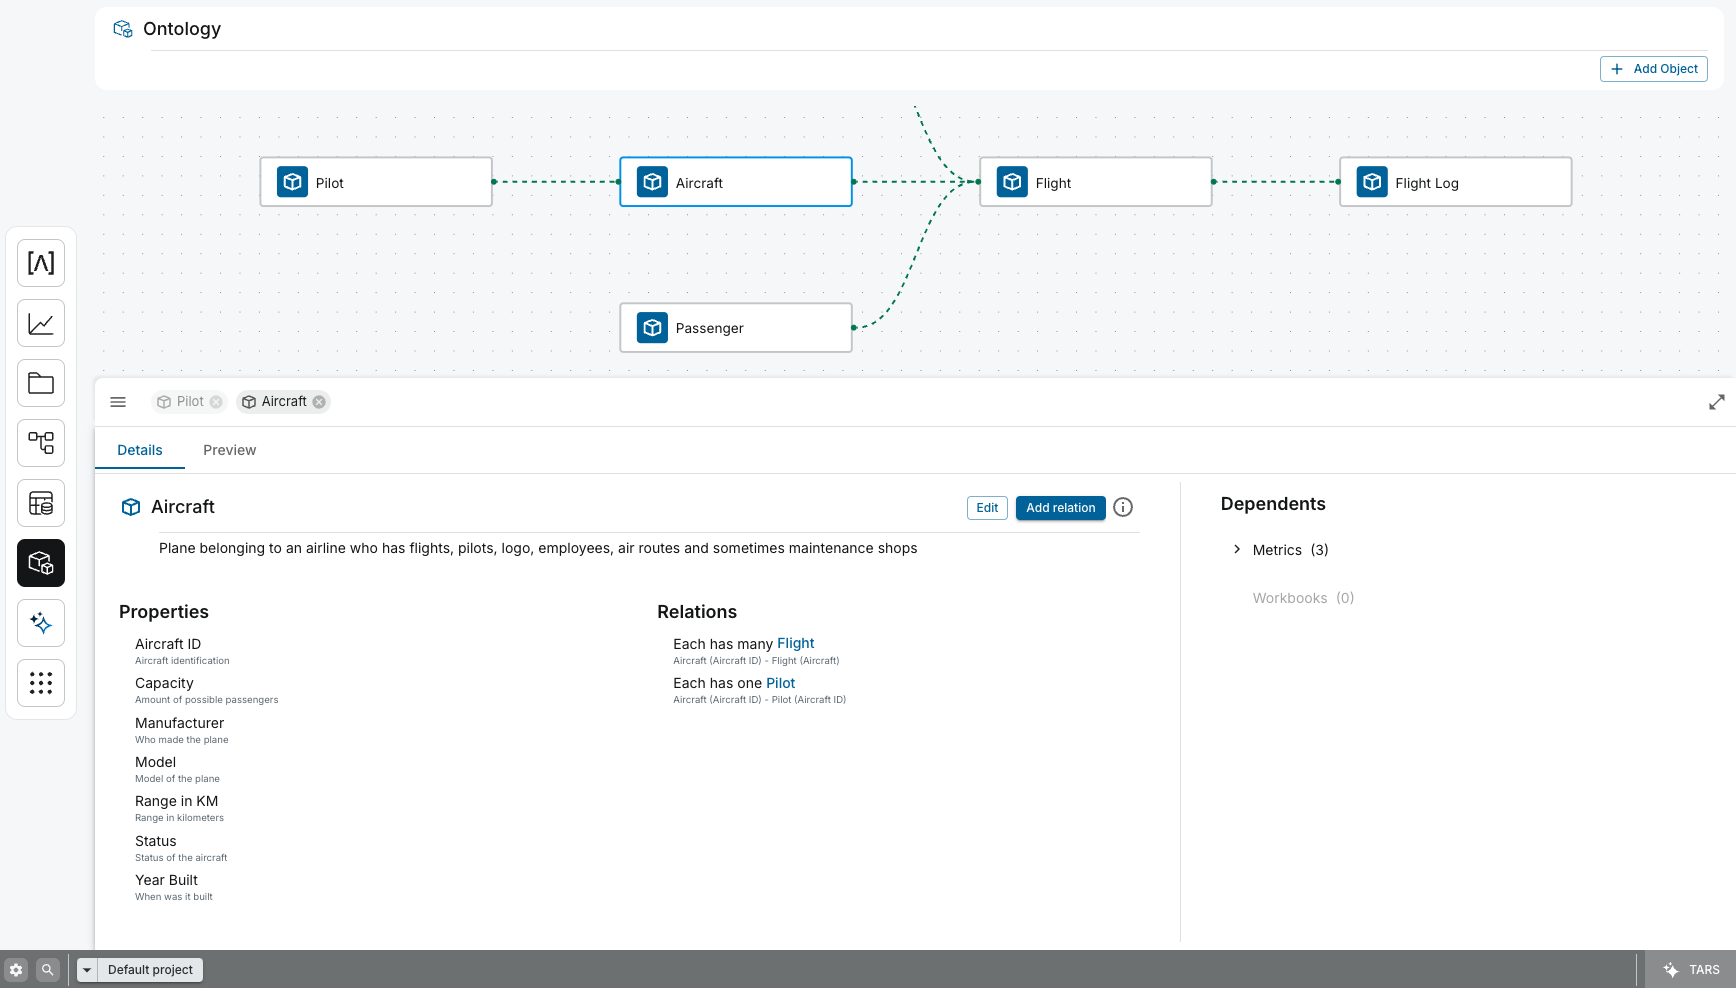
The central part of the screen is the Ontology Graph, a canvas that visually represents your Objects and the relationships between them.
- Object Nodes: Each box in the graph is an Object (e.g.,
Pilot,Aircraft,Flight). These are the core entities of your business. - Relationship Links: The dotted lines connecting the nodes represent the Relationships between objects. The forks in the lines indicate the cardinality of the relationship (e.g., one
Aircraftcan have manyFlights).
You can click and drag to pan the canvas and use the mouse wheel to zoom in and out, making it easy to navigate even very large and complex ontologies.
2. The Details Panel
When you select an Object in the graph (like the Aircraft Object in the example), the Details Panel appears at the bottom. This is where you can inspect and manage the selected Object.
Details Tab
The Details tab provides a comprehensive overview of the Object's configuration.
- Description: A human-readable description of what the Object represents. This context is surfaced across our platform to help users understand the data they are working with.
- Properties: A list of all the attributes that define the Object. Each property has a business-friendly name (e.g.,
Year Built) and a description. These become the trusted, reusable dimensions and features for downstream analytics and ML models. - Relations: A list of the formal relationships this Object has with other Objects. This is the core of the semantic model, enabling you to traverse your business graph and ask complex questions.
Preview Tab
The Preview tab allows you to see the live data for the first 100 instances of the selected Object, directly from the Lakehouse. This is invaluable for quickly validating that your Object is mapped correctly and that the underlying data is as you expect, before it gets used in a critical report.
3. The Dependents Panel
On the right-hand side, the Dependents Panel provides critical, automated data lineage. It shows you all the downstream resources in our Arkham platform that consume the selected Object. This is your primary tool for impact analysis.
- Metrics: Shows a count of all metrics in the Metric Store that are calculated using this Object. Before you change a property, you can see exactly which KPIs will be affected.
- Workbooks: Shows a count of all Workbooks that visualize this Object. This prevents you from breaking dashboards that rely on this part of the business model.
This panel removes the guesswork from maintenance, making your semantic layer safe to evolve and improve over time.
4. Key Actions
- Add Object: The
+ Add Objectbutton in the top-right corner opens a wizard that allows you to create a new Object by mapping it to a production-grade dataset in your Lakehouse. - Edit / Add Relation: Within the Details Panel, these buttons allow you to modify the selected Object's metadata or define new relationships with other Objects on the canvas, enriching the semantic model.
Related Capabilities
- Ontology Overview: Understand how Objects fit into the broader semantic layer.
- Metric Store: The next logical step after modeling your objects is to define reusable business logic.
- Data Catalog: The source of the trusted Production Datasets used to create your Objects.
- Workbooks: See where your Objects and their properties are consumed in downstream dashboards.