
Workbooks: Interactive Analytics
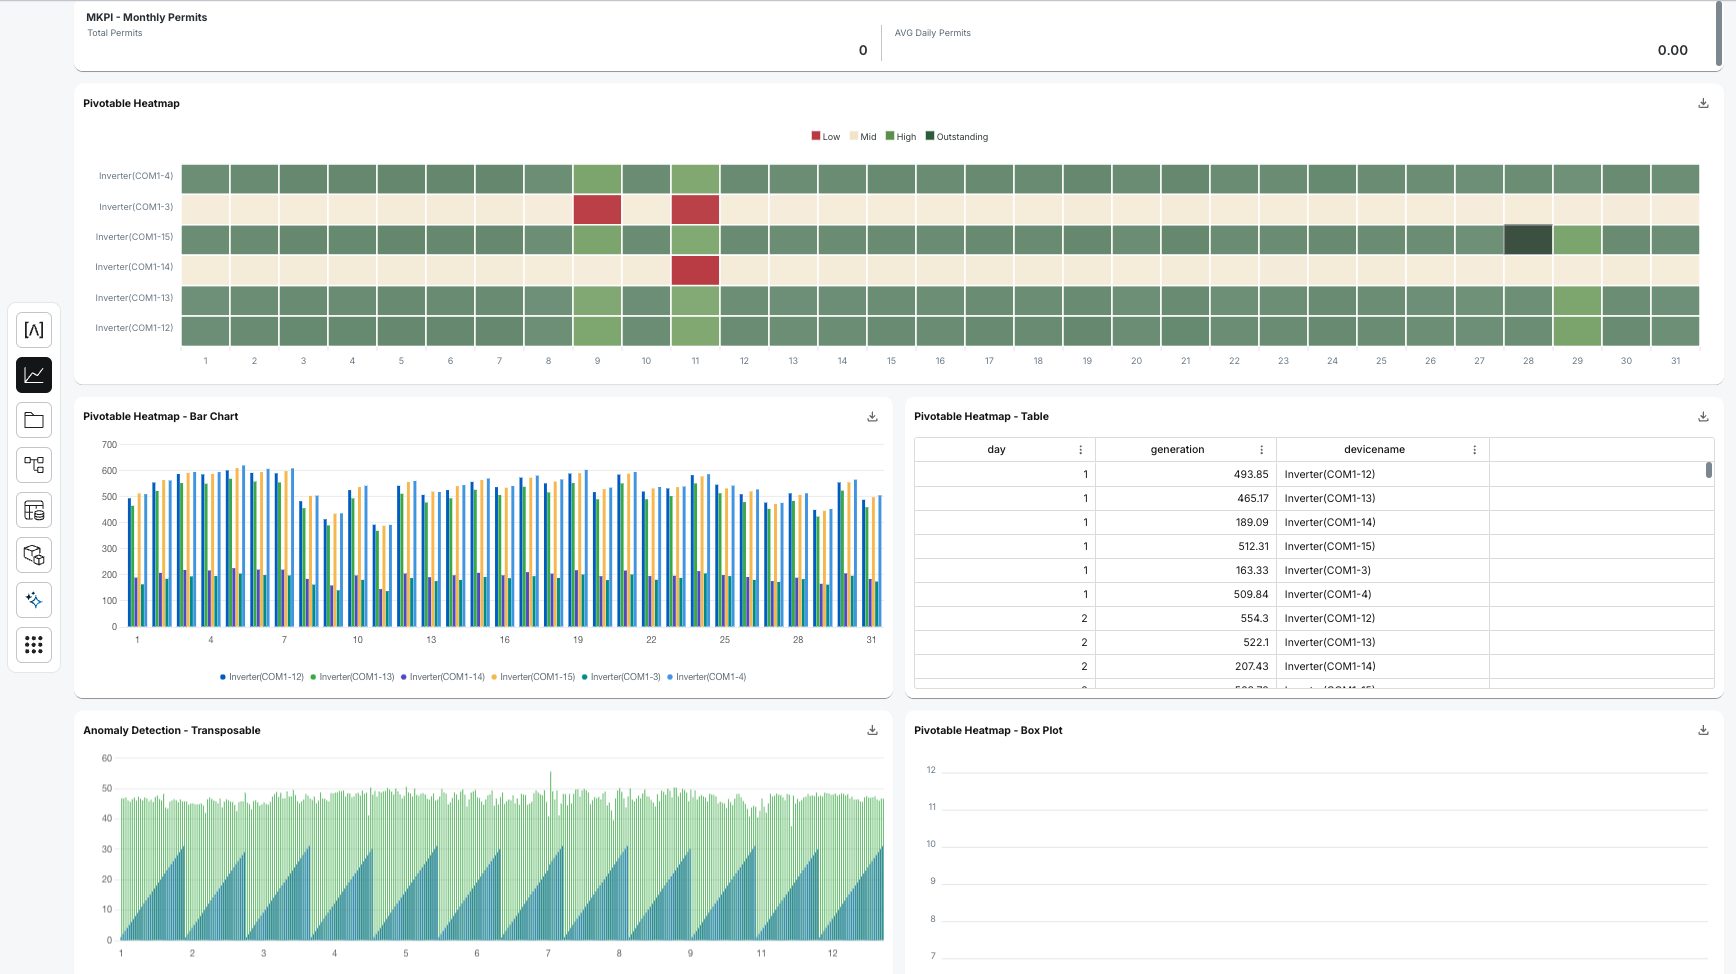
Workbooks are interactive, canvas-style dashboards where builders can arrange and configure a variety of panels—such as tables, charts, and KPIs—directly on top of data from the Arkham Lakehouse. They provide a powerful, low-code environment for creating live data applications and reports for business users.
How They Work: From Metric to Visualization
Workbooks are designed for performance and interactivity. Rather than querying a static data extract, every panel in a Workbook is powered by a live SQL query against a pre-defined Metric or Object, which is executed directly on the Lakehouse. This ensures that the data is always fresh and visualizations update instantly as users apply filters.
The workflow is as follows:
- Define Metrics: Before building a workbook, a builder typically defines reusable Metrics (e.g., `SUM(revenue)`) in the Metric Store.
- Build Panels: In the Workbook's edit mode, you drag and drop panels onto the canvas. For each panel, you select a chart type and connect it to a Metric.
- Configure Interactivity: You can add global or local filters that map to columns in your data. When a user changes a filter value (e.g., selects a new date range), the Workbook automatically injects the corresponding `WHERE` clause into the panel's SQL query.
- Live Refresh: The updated query is executed against the Lakehouse, and the panel visualization refreshes instantly with the new data. Caching is used to optimize performance for repeated queries.
Key Features for Builders
- Low-Code Interface: Build sophisticated dashboards without writing front-end code. The UI handles panel arrangement, chart configuration, and interactivity.
- Directly on the Lakehouse: By running live queries, Workbooks ensure that your stakeholders are always viewing the freshest, most accurate data from the source of truth.
- Reusable Logic: Build on top of the centralized Metrics and Objects you've already curated. This prevents logic from being duplicated and ensures consistency across all analytics.
- Performance Optimization: The platform automatically handles query caching to provide a fast user experience, with the option to bypass the cache (`disableCache=true`) when real-time data is critical.
Core Components
- Panels: The building blocks of a workbook. Choose from various types including Markdown, KPIs, tables, and a wide range of charts (line, bar, donut, etc.).
- Filters: Control the data displayed in panels. Global filters affect all panels, while local filters apply to a single panel.
- Edit Mode: The builder-focused interface for configuring workbooks. Change layouts, modify panel types, rename axes, set colors, and define number formatting.