

ML Hub: Un Entorno de Libretas para ML en Producción
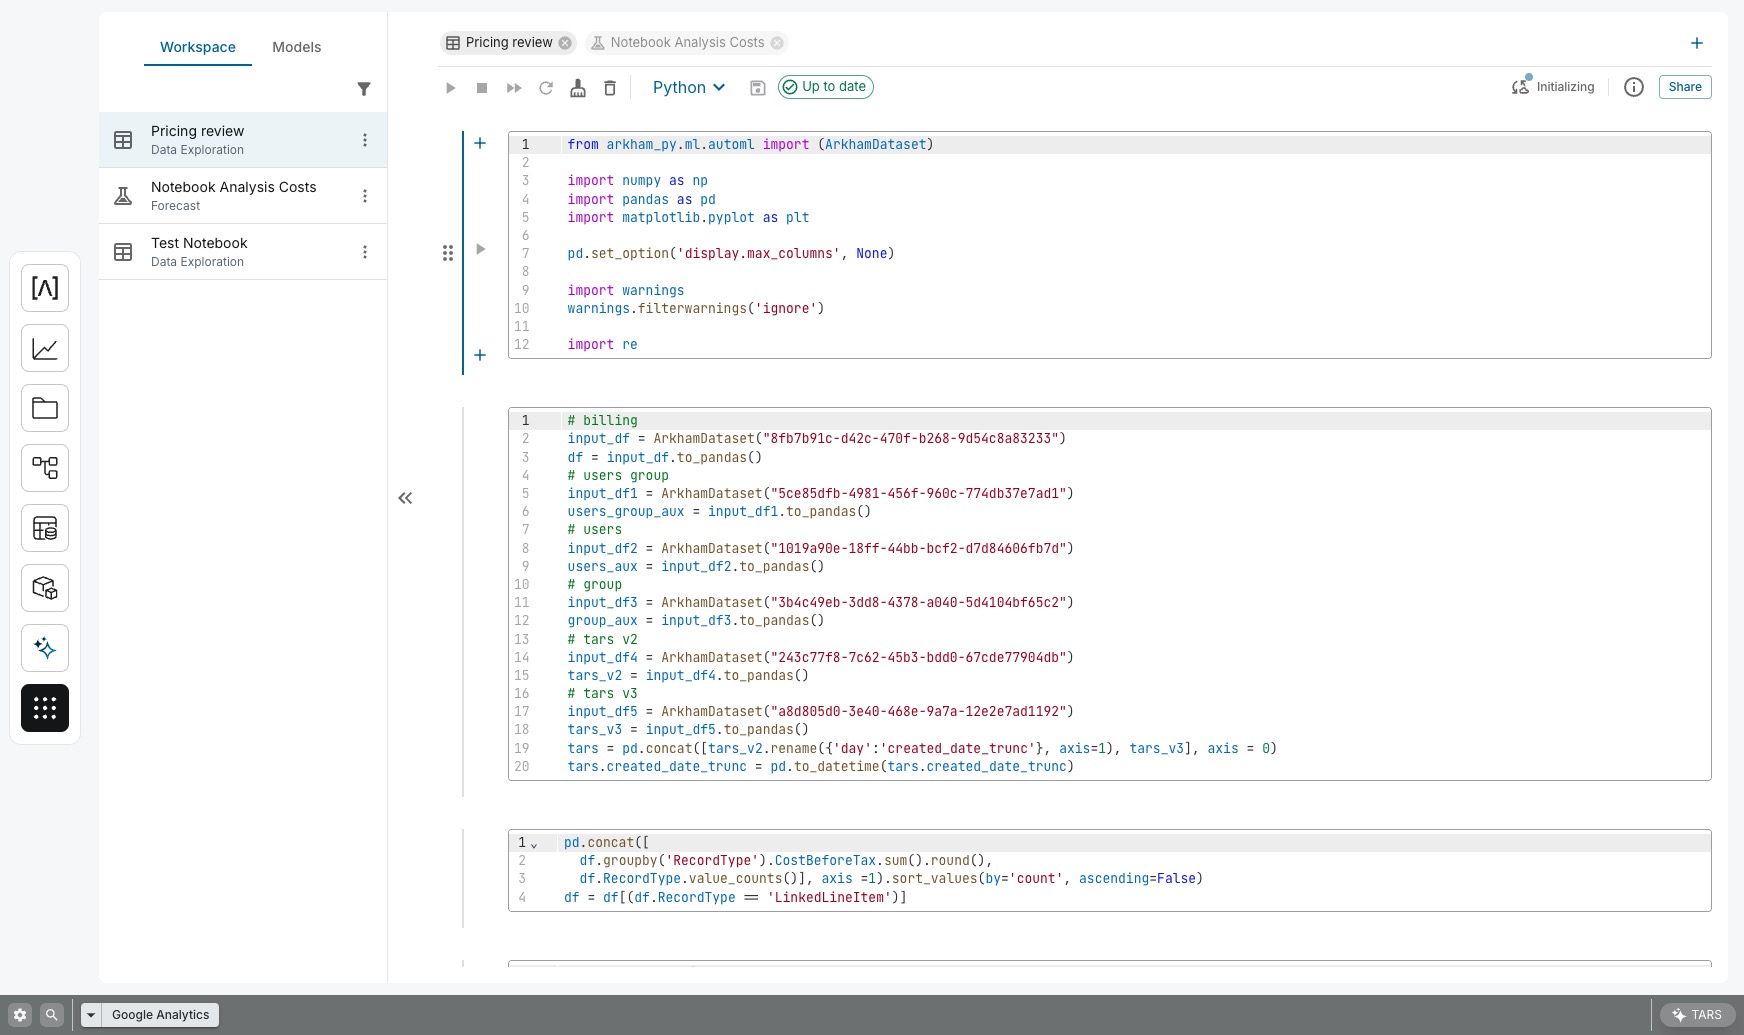
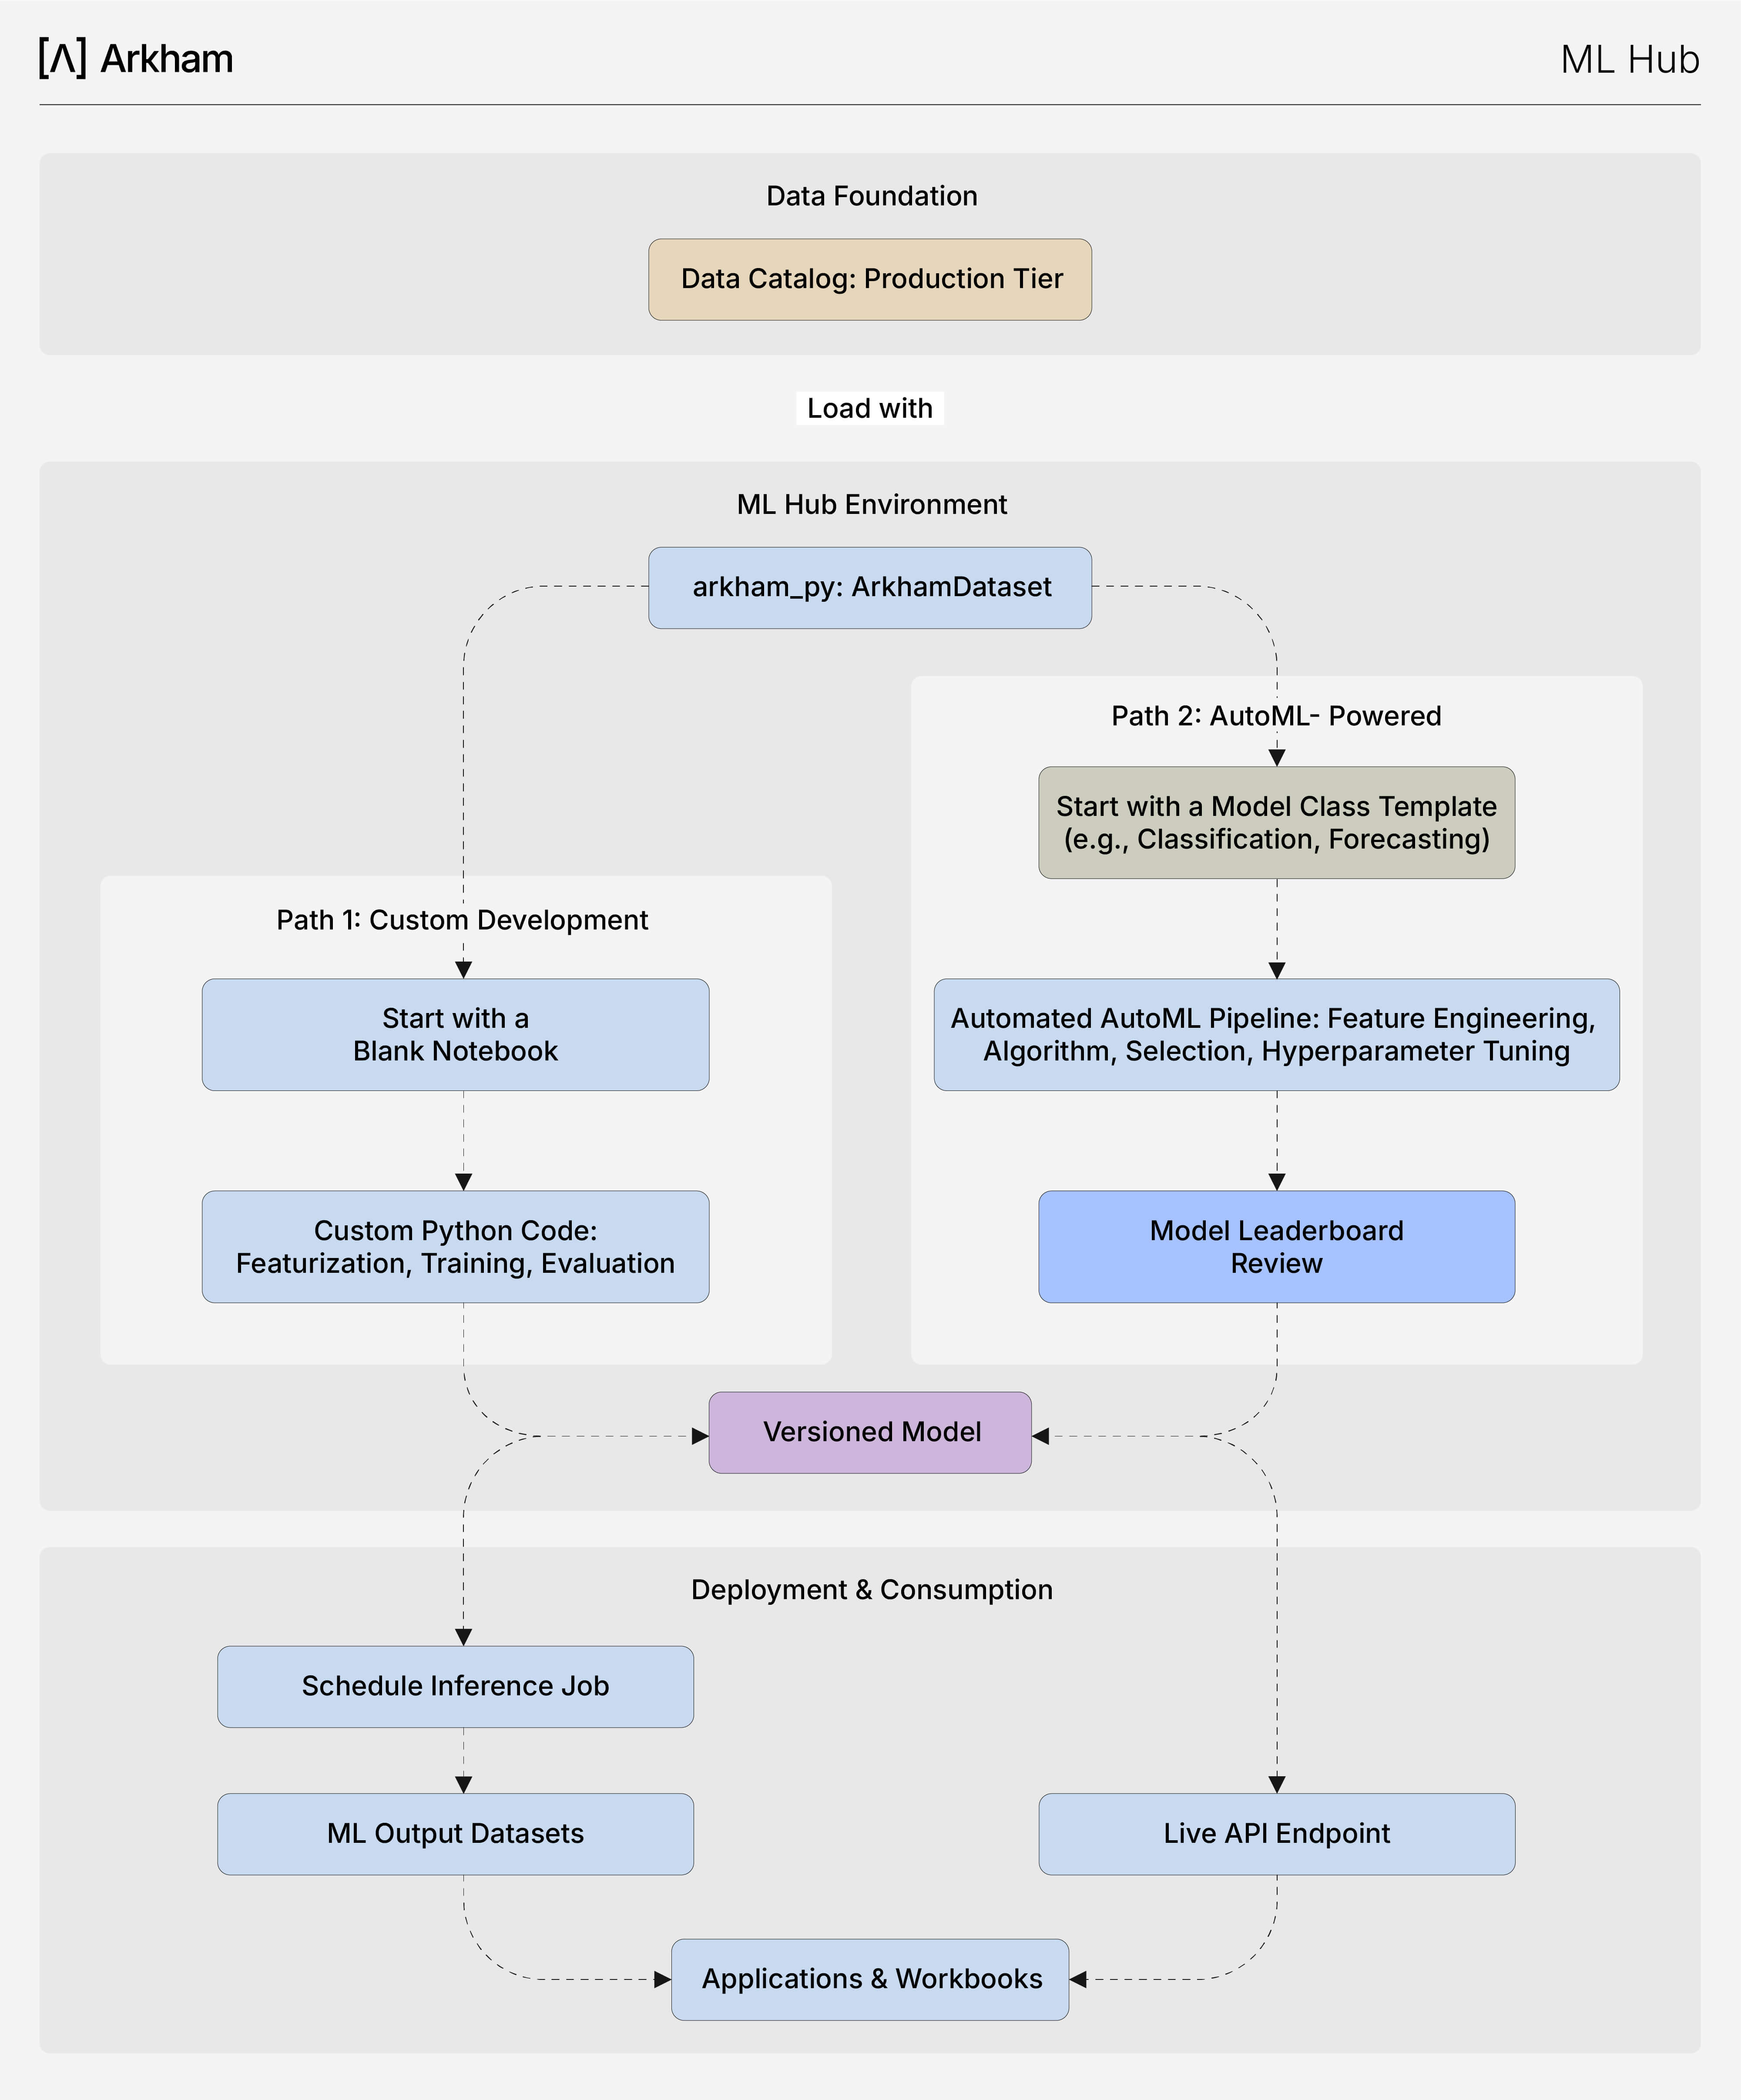
La plataforma de IA de Arkham proporciona un potente entorno AutoML basado en el código, diseñado para equilibrar la automatización con el control del desarrollador. Se accede mediante programación a través de **ArkHampy**, nuestro SDK de Python, y está construido sobre una biblioteca transparente de **Clases Modelo**. Este enfoque le permite crear rápidamente modelos de línea base sólidos y realizar una transición sin problemas a un desarrollo personalizado detallado.Workbooks and other Arkham modules.
Instead of having dozens of similar queries scattered around, you can store metrics in one place — with consistent names, logic, and visualizations.
A space to create, explore, and edit reusable metrics.
What You Can Do
Todo el ciclo de vida de ML se administra dentro de un entorno basado en código, lo que brinda a los científicos de datos el máximo control y reproducibilidad. Utiliza `ArkHampy` para orquestar el acceso a los datos, la configuración del modelo y el entrenamiento.
- View all existing metrics in a single list.
- Search metrics by name.
- Create a new metric from scratch.
- Edit a metric’s name, description, and query.
- Test and configure its visualization before using it elsewhere.
- Insert metrics directly into your Workbooks.
This diagram reveals the workflow of the Metric Library. It describes the origin of business metrics, their visualization, and their consumption in Workbooks and TARS.
Exploring Metrics
When you open the Metric Library, you’ll see a list of all available metrics.
You can use the search bar to find metrics by name or keyword.
This helps you reuse existing ones instead of building new ones from scratch.
Creating a New Metric
There are several ways to create a metric:
From the Metric Library
Click “New Metric” to start from an empty query editor. You can write your SQL query, preview results, and save it once ready.
From Playground
If you already have a query in Playground, you can save it as a metric.This turns your query into a reusable resource that can be shared or added to Workbooks.
From a Dataset
When viewing a Dataset in the Catalog, you can create a metric using it as a base.This will open the Metric Library with your dataset preselected.
Editing a Metric
When you open a metric, you’ll see three main areas:
- Basic Info — Name and description.
- Query Editor — Where you can write or modify your SQL query.
- Data Preview — A quick look at your metric’s results.
Once you’re happy with the configuration, click Save to keep your changes.
Configuring Its Default Visualization
Each metric can have a default visualization, which defines how it’s displayed when used in a Workbook.
To set it:
- Open your metric.
- Enable the Edition mode.
- Choose your preferred type (e.g., Table, Bar Chart, Line, KPI).
- Adjust basic settings like grouping, labels, and formatting.
- Save your changes.
This visualization will automatically appear when the metric is added to any Workbook.
Why Use Metric Library?
The Metric Library ensures everyone in your organization uses consistent definitions and reliable data.
It reduces duplication, simplifies dashboard building, and allows any user to find and reuse trusted metrics easily.
Related Topics
- Workbooks — Create live dashboards using your saved metrics.
- Playground — Write and test queries before turning them into metrics.
- Data Catalog — Explore your datasets and create metrics from them.
SÍGUENOS