

Workbooks: From Purposeful Data to Interactive Decisions
Static dashboards and BI reports often create more questions than they answer. When a business user sees a number, their immediate next step is to ask "why?"—a question that sends analysts back to their tools, creating a slow, frustrating loop between data and decisions.
Arkham's Workbooks are engineered to break this cycle. They are live, interactive dashboards built on a foundation of governed data, allowing users to not only see what's happening but to explore, filter, and ask follow-up questions in real time. By connecting directly to your curated Production Tier Datasets in Data Catalog, and live ML model outputs, Workbooks transform static reports into dynamic decision-making tools.

An interactive Workbook dashboard, where live, governed data is transformed into dynamic visualizations for exploration and decision-making.
How They Work: From Governed Data to Visualization
Our key to building a reliable dashboard is ensuring the data comes from a trusted, well-defined source. Workbooks enforce this by design, providing a low-code canvas for visualizing outputs from either the Production Tier in the Data Catalog or the ML Hub.
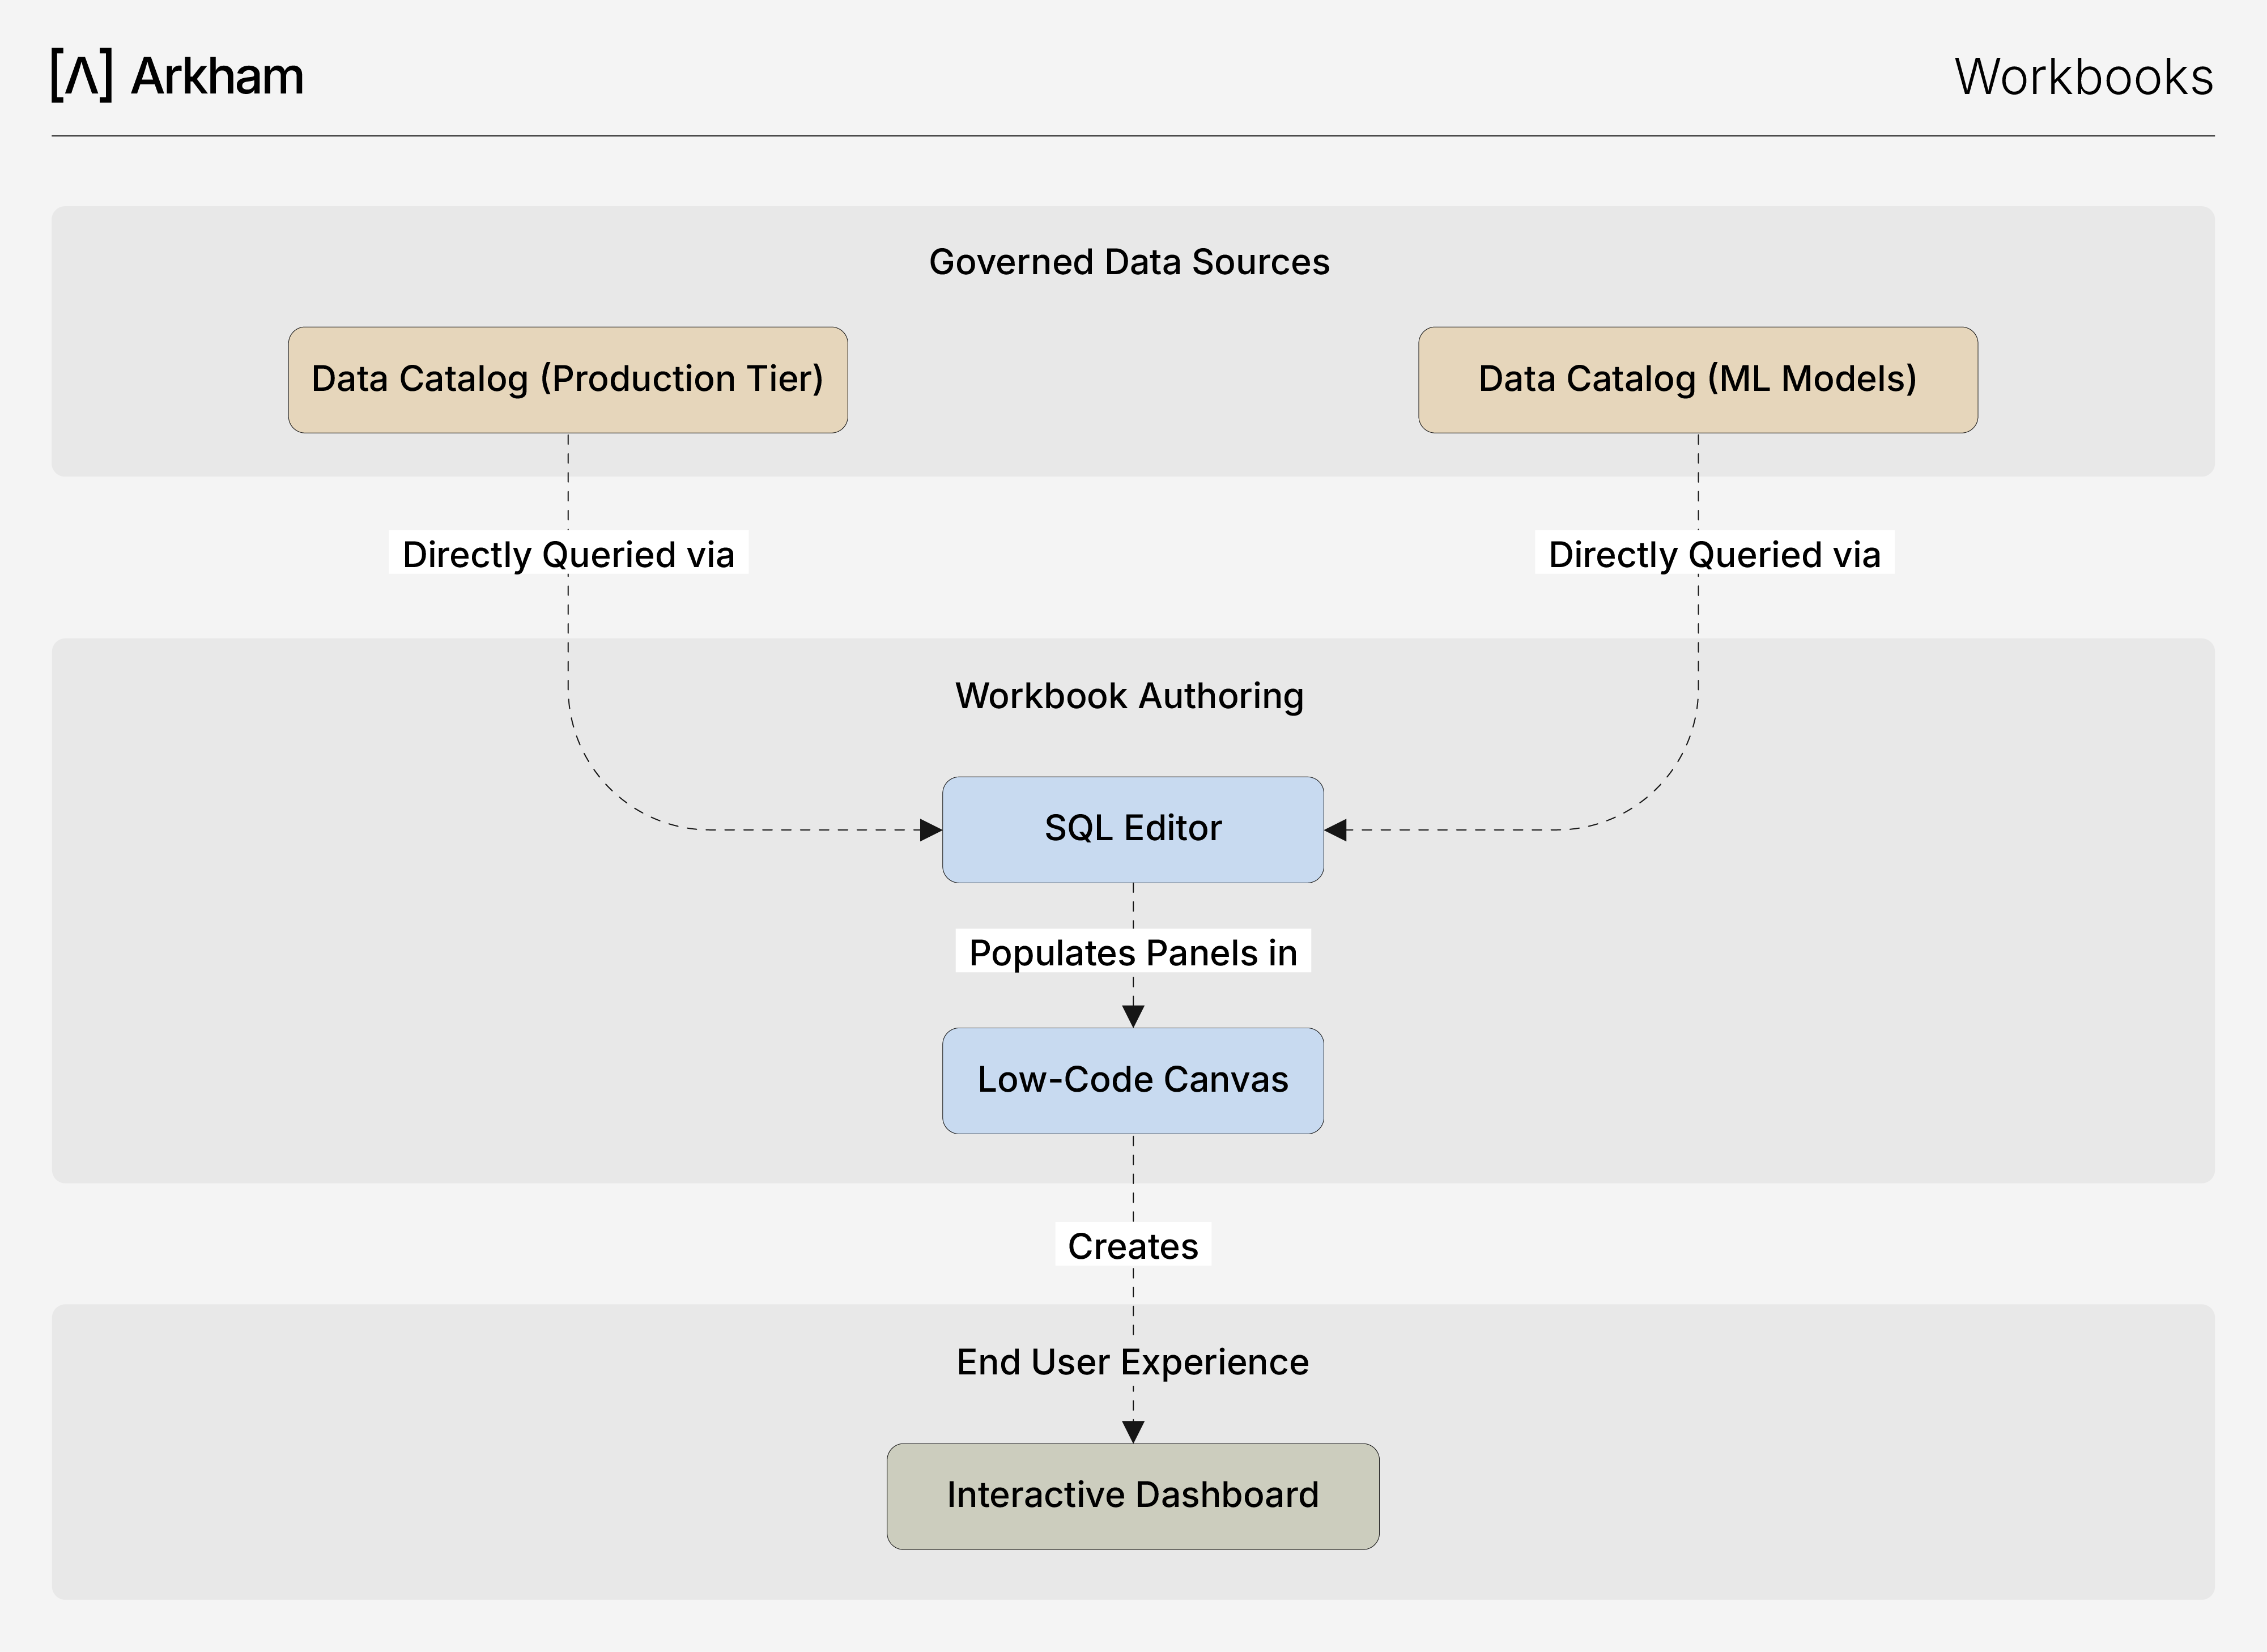
Our Workbook authoring process, illustrating how builders query governed data from our Data Catalog to create interactive dashboards in a low-code, SQL-driven environment.
Our workflow is direct and query driven:
- For Business Intelligence: Our journey begins with a trusted dataset in our Data Catalog. When you add a panel to a Workbooks, a SQL editor slides out, allowing you to directly query the datasets you need (e.g.,
SUM(revenue)). The results of your query then populate the chart or table. - For Model Analytics: Our journey begins in the ML Hub, where you train and deploy a model. Then the model's predictions are available as a source in Workbooks. You can build dashboards to monitor the model's performance over time or create "what-if" scenarios by changing input parameters.
🤖 AI-Assisted Analytics with TARS
TARS acts as an analytical co-pilot directly within our Workbook interface, empowering both builders and consumers to interact with data more intuitively. For Builders: Accelerate dashboard creation by using natural language.
"TARS, create a new KPI panel showing total active_users for the last 30 days from the@prod_users."
For Consumers: Go beyond the dashboard's static filters. Ask follow-up questions to dig deeper into the data.
"TARS, what was the peak revenue day last month?"
Key Features for Builders
- Low-Code Interface: Build sophisticated dashboards without writing front-end code. Our UI handles panel arrangement, chart configuration, and interactivity.
- Governed Data Sources: By building on top of curated datasets in your Data Catalog, we ensure that all dashboards are governed by a single source of truth.
- Direct Querying: Each panel is powered by a SQL query. This gives you full control over the data you display, from simple aggregations to complex joins.
- Direct Model Integration: Seamlessly visualize the outputs of your deployed ML models. This is critical for monitoring model drift, evaluating accuracy, and explaining results to stakeholders.
- Performance Optimization: Our platform automatically handles query caching to provide a fast user experience, with the option to bypass the cache when real-time data is critical.
Core Components
- Panels: Building blocks of a workbook. Choose from various types including Markdown, KPIs, tables, and a wide range of charts (line, bar, donut, etc.).
- Filters: Control the data displayed in panels. Global filters affect all panels, while Local filters apply to a single panel.
- Edit Mode: The builder-focused interface for configuring workbooks. Change layouts, modify panel types, rename axes, set colors, and define number formatting.
- SQL Editor: When editing a panel, a drawer provides a full-featured SQL editor to write the query that will populate your visualization.
Related Capabilities
- AI Platform Overview: Understand how Workbooks fit into our AI Platform ecosystem.
- Data Catalog: The source of the trusted, production-grade data that powers your BI dashboards.
- ML Hub: Create the deployable models whose outputs can be visualized and monitored in Workbooks.
- TARS: Accelerate dashboard creation and analysis with a conversational AI co-pilot.
FOLLOW US